

Ethereum is riding a powerful rally — fueled by record-breaking U.S. spot ETF inflows, growing institutional accumulation, and surging on-chain activity — that has pushed prices to their highest level since 2021 and set the stage for a potential run toward $6,800.
Summary
- ETH price jumped as spot Ethereum ETF inflows jumped.
- Ethereum Treasury companies like SharpLink are accumulating.
- Technical analysis points to an eventual Ethereum price surge to $6,800.
ETF inflows and DeFi dominance boost ETH price
Ethereum (ETH) jumped to a high of $4,170, its highest level since December 2021, and nearly 200% above the lowest level this year.
Demand from American investors is high as evidenced by SoSoValue data, which shows that spot Ethereum ETF inflows jumped by $326 million this week.
These funds have experienced inflows for 14 consecutive weeks, totaling $9.8 billion in cumulative inflows. BlackRock’s ETHA ETF has had cumulative inflows of $9.85 billion and has net assets of $12.35 billion.
Grayscale’s ETHE ETF has experienced net outflows of $4.3 billion and currently holds $4.5 billion in assets. It has shed assets mostly due to its high fees, with an expense ratio of 2.50%. The other top Ethereum funds are by companies like Fidelity, Bitwise, and VanEck.
Additionally, Ethereum treasury companies are accumulating these tokens. SharpLink Gaming bought 22,000 ETH this week, bringing its total assets to $2.17 billion. BitMine and The Ether Machine hold Ethereum worth $3.45 billion and $1.4 billion, respectively.
Investors are accumulating Ethereum due to the network’s growth and its dominant market share across most sectors. For example, Ethereum’s network’s transactions jumped by 52% in the last 30 days to over 47 million, while its fees soared to $48 million.
Ethereum continues to dominate in the decentralized finance industry, with its total value locked jumping to $195 billion and its bridged assets surging to $501 billion.
Ethereum’s stablecoin market share has increased, with the total industry supply reaching $137 billion. This growth will make it a top beneficiary from the recently signed GENIUS bill in the United States.
Ethereum price technical analysis
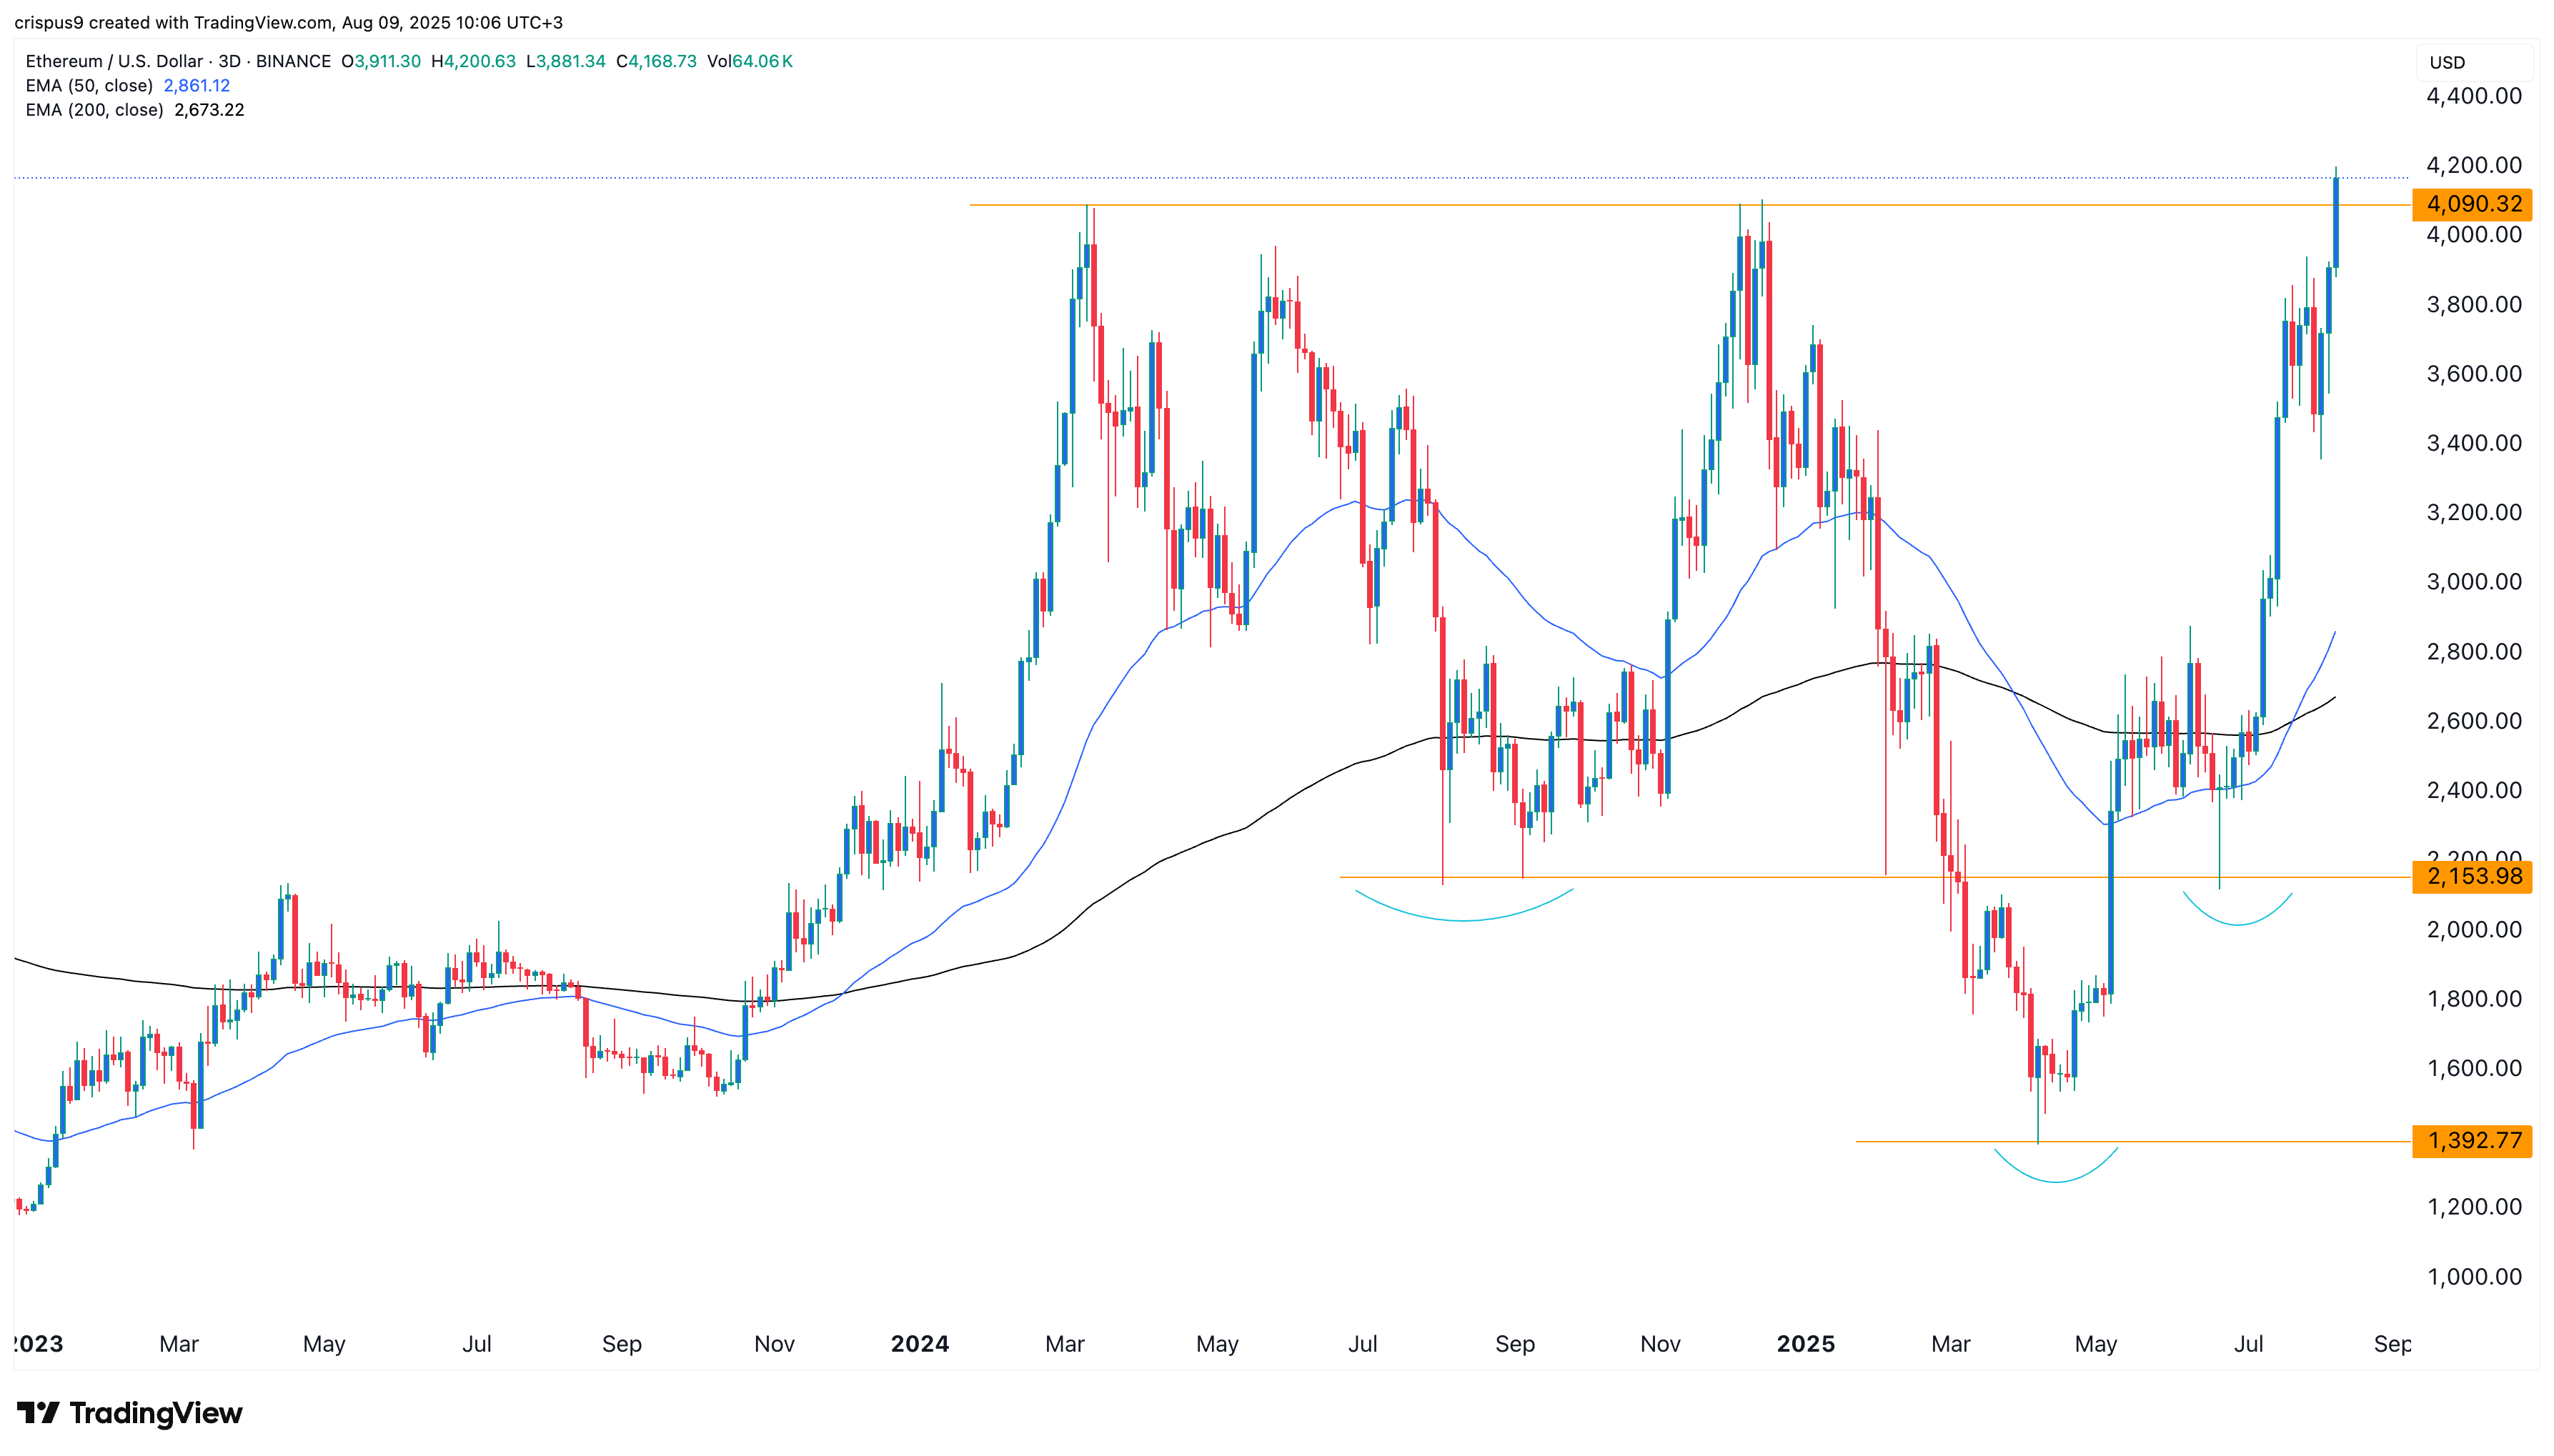
The three-day chart shows that the ETH price has been in a strong bull run since April, when it bottomed at $1,392. It recently formed a golden cross pattern as the 50-day and 200-day moving averages crossed each other. A golden cross often confirms a bullish breakout.
Ethereum also formed an inverse head-and-shoulders pattern, with its neckline at $4,090. This pattern is made up of a head, which is at the April low of $1,392. It also has two shoulders at $2,153.
The distance between the head and shoulders is $2,700. Adding this amount to the neckline yields a target price of nearly $6,800, representing a 68% increase from the current level.